Measuring Ground and Surface Water Nitrates Using HydroMetrics UV Optical Sensors in Agriculture
Nitrate contamination of water sources is a critical issue in agriculture. Excess nitrogen from fertilizers and manure can leach into groundwater or be transported via surface runoff into streams and rivers, leading to environmental and human health concerns. Continuous monitoring of nitrate levels is essential for farmers to manage nitrogen application efficiently and minimize water pollution.

HydroMetrics UV optical sensors provide a reliable and cost-effective way to measure nitrate concentrations in real-time. These sensors use ultraviolet (UV) absorbance technology to detect nitrate levels in water without the need for chemical reagents or frequent manual sampling. This guide provides a practical approach to using HydroMetrics UV optical sensors for continuous nitrate monitoring in both ground and surface water sources on farms.
1. Understanding HydroMetrics UV Optical Sensors
a. How They Work

HydroMetrics UV optical sensors operate on the principle of UV spectroscopy. Nitrate absorbs UV light at specific wavelengths (typically around 220 nm). The sensor measures this absorbance, compares it to the reference wavelength (typically around 270 nm) and converts it into nitrate concentration using calibration models. Unlike traditional sampling and lab-based analysis, this method provides immediate, continuous readings, making it highly useful for on-site agricultural applications.

Key Features
- Real-time, continuous monitoring: Provides instant nitrate level readings.
- No reagents required: Reduces ongoing maintenance costs.
- Weather-resistant: Suitable for deployment in diverse agricultural environments.
- Data logging and remote transmission: Allows integration with farm management software for improved decision-making.

2. Applications in Agriculture
a. Groundwater Monitoring
Nitrate leaching from fertilizers and manure can infiltrate groundwater supplies, posing risks to drinking water sources. Installing HydroMetrics sensors in wells or boreholes enables:
- Early detection of nitrate contamination.
- Assessment of long-term trends in groundwater quality.
- Compliance with water quality regulations.
- Measurement of conditions before and after mitigation actions.
b. Surface Water Monitoring
Runoff from fields carries nitrates into rivers, lakes, and drainage ditches. By placing sensors in streams or ponds, farmers can:
- Identify peak nitrate runoff periods.
- Assess the impact of different fertilizer management strategies.
- Improve nutrient management planning.

c. Irrigation Water Quality Management
Monitoring nitrate levels in irrigation water ensures:
- Optimal nitrogen application through fertigation.
- Prevention of excessive nitrate accumulation in soil and crops.
- Efficient use of water resources.

3. Step-by-Step Guide to Deploying HydroMetrics UV Optical Sensors
a. Selecting the Monitoring Location
Choose locations that represent critical water sources on the farm. These might include:
- Wells and boreholes for groundwater monitoring.
- Streams, ponds, or ditches for surface water tracking.
- Irrigation supply points to monitor nitrate levels in water used for crops.
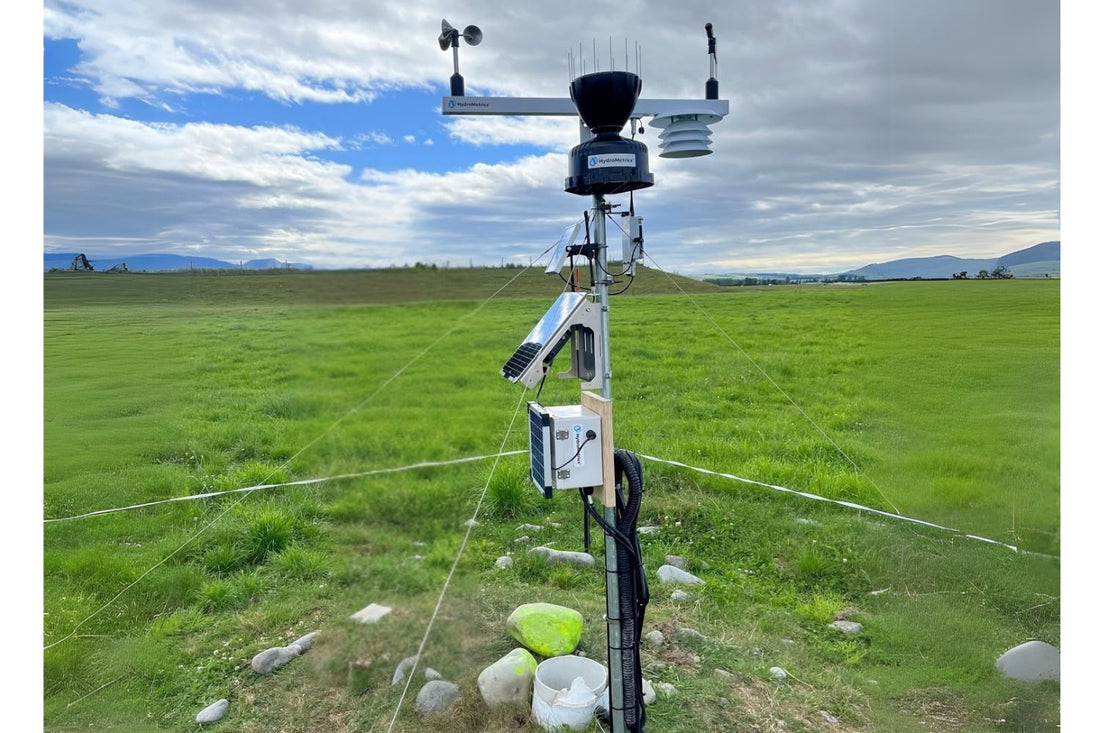
b. Installing the Sensor
- Mounting: Secure the sensor in a fixed position using a bracket, pole, or buoy.
- Submersion depth: Ensure the sensor is placed at an appropriate depth to avoid surface debris while capturing representative water samples.
- Power supply: Connect the sensor to an appropriate power source (battery, solar panel, or electrical outlet).
c. Calibration and Configuration
- Factory Calibration: HydroMetrics sensors come pre-calibrated, but field calibration may be required for local conditions.
- Initial Baseline Readings: Collect baseline measurements to compare against lab-analyzed water samples.
- Software Setup: Use the provided software or integrate with a farm management platform to configure data logging and alerts.
d. Data Collection and Interpretation
- Real-Time Data Viewing: Check nitrate levels on a connected device or dashboard.
- Trend Analysis: Observe patterns over time to correlate nitrate spikes with farming activities like fertilization or irrigation.
- Alarm Settings: Set threshold alerts to notify when nitrate levels exceed safe limits.
e. Maintenance and Troubleshooting
- Routine Cleaning: Remove sediment buildup or algae to ensure sensor accuracy. The HydroMetrics Water-Jet™ pump GW50 add-on effectively extends the cleaning interval required.
- Validation: Checking the sensor is correctly reading ‘zero’ through the use of a de-ionised (DI) water verification test. Known nitrate standard solutions can also be used as an additional verification step.
- Performance Checks: Compare sensor readings with periodic lab tests to ensure calibration accuracy.
- Firmware Updates: Keep the sensor’s software updated for optimal performance.
4. Benefits of Using HydroMetrics UV Optical Sensors in Farming
a. Environmental Benefits
- Reduces water contamination: Early detection of high nitrate levels helps prevent excessive nutrient runoff.
- Promotes sustainable practices: Enables precise nitrogen management, reducing unnecessary fertilizer use.
- Protects aquatic ecosystems: Minimizes the risk of eutrophication and hypoxia in nearby water bodies.
b. Economic Benefits
- Saves costs on lab testing: Continuous monitoring reduces reliance on expensive laboratory analysis.
- Improves fertilizer efficiency: Farmers can adjust applications based on real-time data, reducing waste.
- Enhances regulatory compliance: Meets nitrate pollution limits set by environmental agencies, avoiding fines and penalties.
c. Operational Benefits
- Time-efficient: Eliminates the need for frequent manual sampling.
- Remote monitoring capability: Allows farmers to check water quality from anywhere.
- User-friendly interface: Provides straightforward data visualization and alerts.
- Source Tracking: Allows a land owner to determine the nitrate loading coming into and leaving farming areas, allowing an estimation of the farm’s ‘nitrate footprint’.
5. Practical Use Case Example
Scenario: A Dairy Farm Managing Nitrate Runoff
A dairy farm applying manure as fertilizer wants to monitor nitrate runoff to ensure compliance with water quality regulations. The farm installs HydroMetrics UV optical sensors in:
- A nearby stream to track nitrate runoff.
- A groundwater well supplying drinking water to monitor leaching.
- An irrigation pond to measure nitrate levels in reused water.
By analyzing real-time data:
- Determine the nitrate load that is imported into the farm from nearby activities outside the farm.
- The farmer identifies periods of high runoff following heavy rainfall.
- Adjustments are made to manure application timing and buffer strip placements.
- Long-term data trends help optimize nutrient management, reducing fertilizer costs and environmental impact.

5. Conclusion
HydroMetrics UV optical sensors provide an advanced, efficient, and practical solution for continuous nitrate monitoring in agricultural water sources. By integrating these sensors into farm operations, farmers can make data-driven decisions to optimize fertilizer use, manage stock rotation, implement cover crops, consider feed varieties, reduce environmental impacts, check farm potable water and comply with water quality regulations.
For best results, proper sensor installation, calibration, and data interpretation are crucial. By adopting this technology, farms can achieve more sustainable and profitable agricultural practices while safeguarding water resources for future generations.
Appendix
1. What is the Nitrate Problem in Agriculture?
Intensive farming causes losses of nitrogen (N) due to mineralization of the soil's N pools and because the amount of N used as fertilizers often exceeds the nutrient demand of the crops (Dalgaard et al., 2011; Hansen et al., 2000; Sebilo et al., 2013). This results in N pollution of the aquatic environment, including shallow groundwater, threatening drinking water resources and human health (Schullehner et al., 2018; Ward et al., 2018), as well as groundwater-associated and -dependent ecosystems (Hinsby et al., 2012). For example, in Denmark groundwater is the only source of drinking water, and about 60% of the land is under agricultural cultivation. Therefore, agricultural production, sustainable environmental management, and protection of groundwater resources are of crucial importance to society.
2. The Science of N losses
N losses from the soil to groundwater and surface water are controlled by a complex interplay between hydrological and geochemical processes (Eludoyin et al., 2017; Jessen et al., 2017; McAleer et al., 2017; Molenat et al., 2008; Petry et al., 2002; Postma et al., 1991).
N is mobilized primarily as nitrate via water. In addition, nitrate is reactive and can therefore be reduced along the flow pathways. Nitrate reduction reactions are strongly dependent on the redox structure and capacity of the subsurface (Jessen et al., 2017; McAleer et al., 2017; Postma et al., 1991).
Locally, the distribution of flow pathways and redox structure of a site may play a key role in determining the timing and quantity of nitrate losses to groundwater and surface water (McAleer et al., 2017; Molenat et al., 2008; Petry et al., 2002).
3. Measurement
The sensor utilises UV absorbance for the measurement principle and measures absorbance at two wavelength bands, the first centred on 220 nm and the second on 270 nm. The 220 nm signal is the primary nitrate estimation signal, while the 270 nm absorbance is used to correct for non-nitrate interferences. We deliver factory-calibrated sensors. The sensors are calibrated against KNO3 and formazine turbidity standards.
A point to note regarding accuracy is, as nitrate levels decrease and non-nitrate absorbance’s increase (typically Turbidity and Dissolved Organic Carbon) the signal to noise ratio reduces increasing the chance of calibration accuracy impact.
Turbidity
Turbidity and absorption at both wavelengths are correlated. However, the amount of interference caused by turbidity will depend on the size and shape of particles present. For turbidity up to 45 NTU, interferences are negligible and normally well compensated for with the built-in calibration. As the absorption properties of turbidity can vary, absolute accuracy may be affected even at lower turbidity.
Increasing turbidity does reduce the upper range of the sensor. While 50 mg/L NO3-N can normally be measured in very clean water with little non-nitrate absorbance, the presence of turbidity reduces the measurement range.
Other non-nitrate interferences
Conductivity
As conductivity is a result of a number of different ions that may be present in the water, the exact effect of conductivity on the accuracy of the sensor, especially when combined with other non-nitrate interferences, cannot always be predicted. Laboratory testing has indicated the sensor calibration is not significantly affected below 2000 uS/cm for nitrate concentrations below 30 mg/L.
Dissolved organic carbon (DOC)
DOC can provide a significant challenge for an optical nitrate sensor calibration as its absorbance peak is similar to nitrate, making correction difficult. If the groundwater you plan to measure has elevated DOC levels, then the accuracy of the nitrate measurement may be reduced.
Biofilms
Some wells can be biologically active and biofilms may develop on the measurement tube. In most instances the non-nitrate interference correction that is part of the calibration built into the sensor will manage some level of biofilm build up; however, the sensor will require cleaning periodically to reduce potential error in the nitrate calculation. Some wells grow biofilms very rapidly; if this problem occurs it may be necessary to sterilise the bore.
4. Installation Site selection
The GW50 sensor is designed for groundwater installation where the sensor is located in a groundwater sampling bore. The sensor is designed to be installed in a 50 mm or larger Nominal Bore (NB) well casing, but be careful these smaller diameter bores have not deformed during installation as this increases the risk of a sensor becoming lodged in the bore. If installing the sensor in a production bore, the effect of pumping and electrical interferences from submersible pumps cannot be predicted and should ideally be avoided. Low DOC and turbidity levels increase the chances of a successful installation.
We recommend installation of the sensor in the screened area of the bore to ensure regular water exchange and reduced risk of nitrate stratification that may develop and affect readings.
Sufficient water in the bore is required to ensure the sensor’s measurement chamber is submersed.
Where there is a bore 65 mm or larger nominal bore (NB), the pump cleaner model may be installed.
Bore installation:
- DO NOT hang the sensor by the data cable.
- Before installing, the sensor should be cleaned even if it is new. There will be a film on the sensor tube that needs to be removed to ensure the sensor is operating correctly.
- A mounting bracket and shackle is provided at the top of the sensor and a suitable wire or rope should be attached to lower the sensor in the well casing.
- 1.5 mm nylon covered stainless wire rope is ideal for this.
- Ensure the cable is securely anchored at the top of the well to prevent the probe being lost down the well.
- Taping the rope or cable to the data cable at intervals of approximately 1 m is a useful way to prevent the data cable and suspension rope from tangling while installing or removing the sensor.
- Make sure a little slackness in the data cable between taping points is maintained to ensure the sensor weight is supported on the suspension cable or rope.
- If a GW50PC unit is installed, clear any air bubbles trapped or any foreign material by running the pump for a few seconds.
- Once the sensor has been installed, take a reading from the sensor to ensure it is operating correctly. If the sensor has an air bubble the ABS270 and ABS220 will read approximately 0.4-0.5 units for each. If there was a large build-up of matter the ABS220 and ABS270 value will be reading NAN.

Where there is no room for a sensor to be fitted down a bore as the bore is smaller than 50 mm NB or there is a production pump installed down the bore, the GW50FC Flow Cell unit can be used. The water is pumped through the sensor at the surface near the bore. Either the production pump or a fit for purpose pump would be used to pump the water through the sensor. A pressure reducer may be required if water pressure is above 2 bar.
Surface water installations are achievable where the turbidity and DOC is within an acceptable range for the site. Careful consideration around the installation method must be thoroughly planned to meet the changing conditions, high rainfall events, weed and organic organisms and changing water levels are a few of the common ones. Using a pipe to protect the sensor from a lot of these factors helps mitigate their impact, as well as where the sensor is mounted in case of a flooding event.
5. High Frequency vs Spot or Grab Sampling
Internationally there is a trend toward use of high frequency (continuous), in-situ measurement of water properties (e.g., temperature, turbidity, dissolved oxygen). Recently, this has included measurement of contaminants such as nitrogen (N), specifically nitrate-N. This recognises that monthly discrete (spot) water quality measurements and samples obtained from traditional monitoring programmes cannot capture or characterise rapid changes in water quality that can affect human and aquatic health. For example, a significant proportion of an annual nitrate load may be transported during short-duration runoff events that occur outside of routine sampling visits. This makes it difficult to accurately estimate the true annual load of nitrate-N lost from a catchment.
Why High Frequency?
High frequency nitrate-N data are increasingly important to regional councils for several reasons, including:
- improving estimates of the impacts of land use on water quality through better characterisation of temporal variation in concentrations – including identification of peak runoff concentration and potential to improve source identification;
- reducing uncertainty in the examination of trends in nitrate-N concentrations;
- improving the accuracy of estimated nitrate-N loads, which are key to establishing water quality limits for freshwater management and meeting potable water limits;
- calibrating nitrate-N surface water and groundwater transport models;
- improving the ability to predict downstream water quality (e.g., river intakes used for potable and industrial supply), and
- identifying periods when nitrate-N concentrations or loads require additional management.
